What is Factor Analysis
Factor analysis is a way to condense the data in many variables into a just a few variables. For this reason, it is also sometimes called “dimension reduction.” You can reduce the “dimensions” of your data into one or more “super-variables.” The most common technique is known as Principal Component Analysis (PCA).
See how Qualtrics iQ can speed up your survey analysis
Request Demo
How Factor Analysis Can Help You
Factor analysis is useful in:
- Condensing variables
- Uncovering clusters of responses
Say you ask several questions all driving at different, but closely related, aspects of customer satisfaction:
- How satisfied are you with our product?
- Would you recommend our product to a friend or family member?
- How likely are to you purchase our product in the future
But you only want one variable to represent a customer satisfaction score. One option would be to average the three question responses. Another option would be to create a factor dependent variable. This can be done by running PCA and keeping the first Principal Component (also known as a factor). The advantage of PCA over an average is that it automatically weights each of the variables in the calculation.
Say you have a list questions and you don’t know exactly which responses will move together and which will move differently; for example, purchase barriers of potential customers. The following are possible barriers to purchase:
- Price is prohibitive
- Overall implementation costs
- We can’t reach a consensus in our organisation
- Product is not consistent with our business strategy
- I need to develop an ROI, but cannot or have not
- We are locked into a contract with another product
- The product benefits don’t outweigh the cost
- We have no reason to switch
- Our IT department cannot support your product
- We do not have sufficient technical resources
- Your product does not have a feature we require
- Other (please specify)
Factor analysis can uncover the trends of how these questions will move together. The following are loadings for 3 factors for each of the variables.
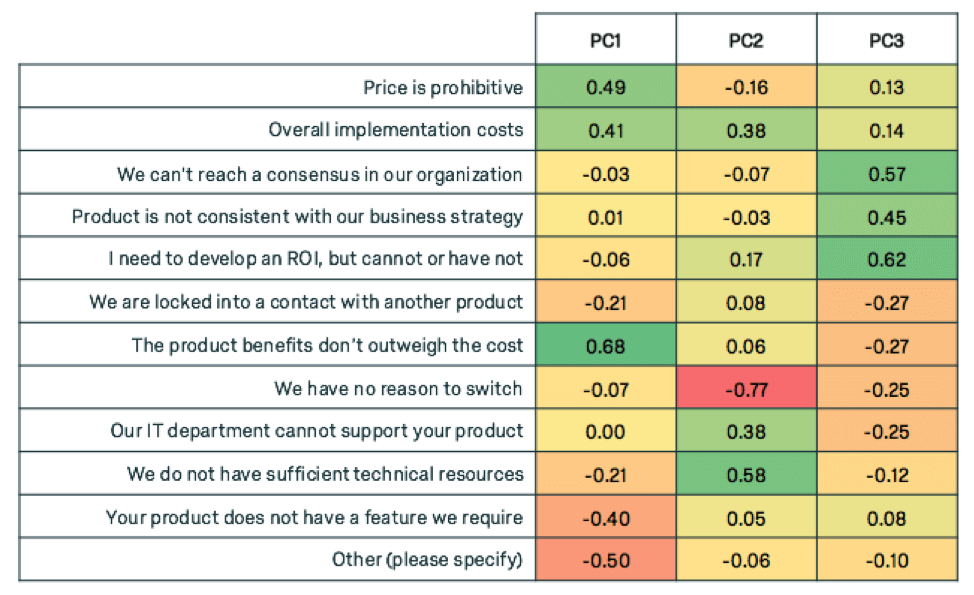
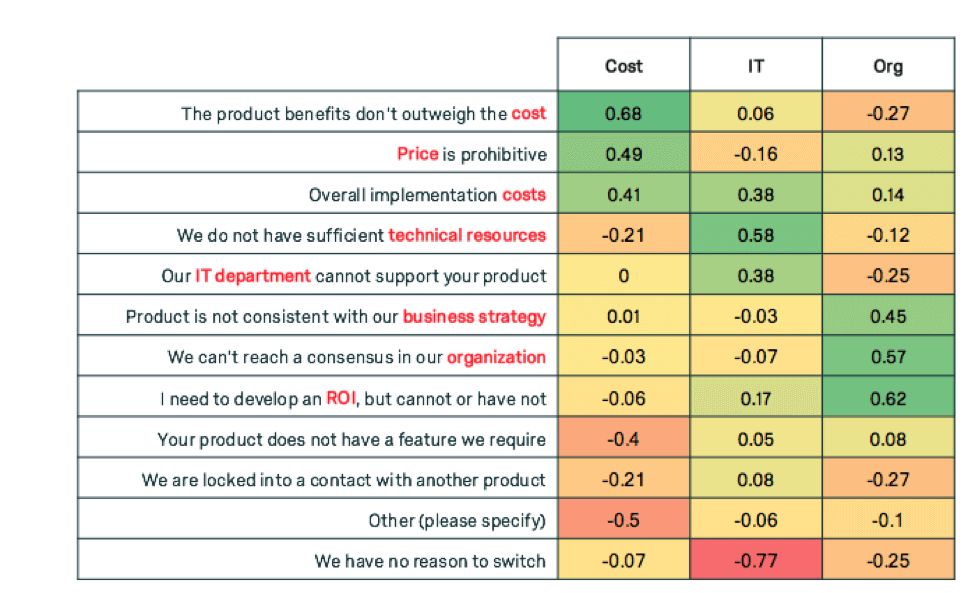
Notice how each of the principal components have high weights for a subset of the variables. The first component heavily weights variables related to cost, the second weights variables related to IT, and the third weights variables related to organisational factors. We can give our new super variables clever names.
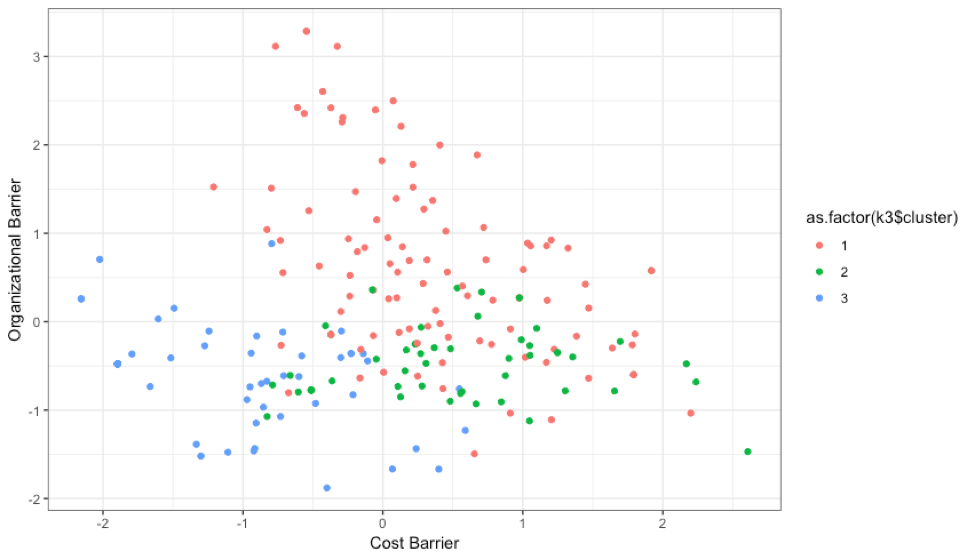
If we were to cluster the customers based on these three components, we can see some trends. Customers tend to be high in Cost barriers or Org barriers, but not both.
Examples of Factor Analysis Studies
Factor analysis, including PCA, is often used in tandem with segmentation studies. Customers or clients might be segmented using PCA itself or it might be an intermediary step to reduce variables before using KMeans to make the segments.
Factor analysis provides simplicity after reducing variables. For long studies with large blocks of Matrix Likert scale questions, the number of variables can become unwieldy. Simplifying the data using factor analysis helps analysts focus and clarify the results.
Sample Questions
Exactly which questions to perform factor analysis on is an art and science. Choosing which variables to reduce takes some experimentation, patience and creativity. Factor analysis works well on Likert scale questions and Sum to 100 questions types.
Factor analysis works well on matrix blocks of the following question genres:
Psychographics (Agree/Disagree):
- I value family
- I believe brand represents value
Behavioral (Agree/Disagree):
- I purchase the cheapest option
- I am a bargain shopper
Attitudinal (Agree/Disagree):
- The economy is not improving
- I am pleased with the product
Activity-Based (Agree/Disagree):
- I love sports
- I sometimes shop online during work hours
Behavioral and psychographic questions are especially suited for factor analysis.
Sample Output Reports
Factor analysis simply produces weights (called loadings) for each respondent. These loadings can be used like other responses in the survey.
| Cost Barrier | IT Barrier | Org Barrier | |
| R_3NWlKlhmlRM0Lgb | 0.7 | 1.3 | -0.9 |
| R_Wp7FZE1ziZ9czSN | 0.2 | -0.4 | -0.3 |
| R_SJlfo8Lpb6XTHGh | -0.1 | 0.1 | 0.4 |
| R_1Kegjs7Q3AL49wO | -0.1 | -0.3 | -0.2 |
| R_1IY1urS9bmfIpbW | 1.6 | 0.3 | -0.3 |
See how Qualtrics iQ can speed up your survey analysis