-

Customer Experience -

Employee Experience -

Brand Experience -

Core XM -

Design XM
Dashboard Notifications
About Dashboard Notifications
If you’re interested in your CX program telling you when it’s time to step in and take action, you can set up notifications to alert you when there’s significant change in your dashboard metrics. This allows you and your team to action these changes accordingly.
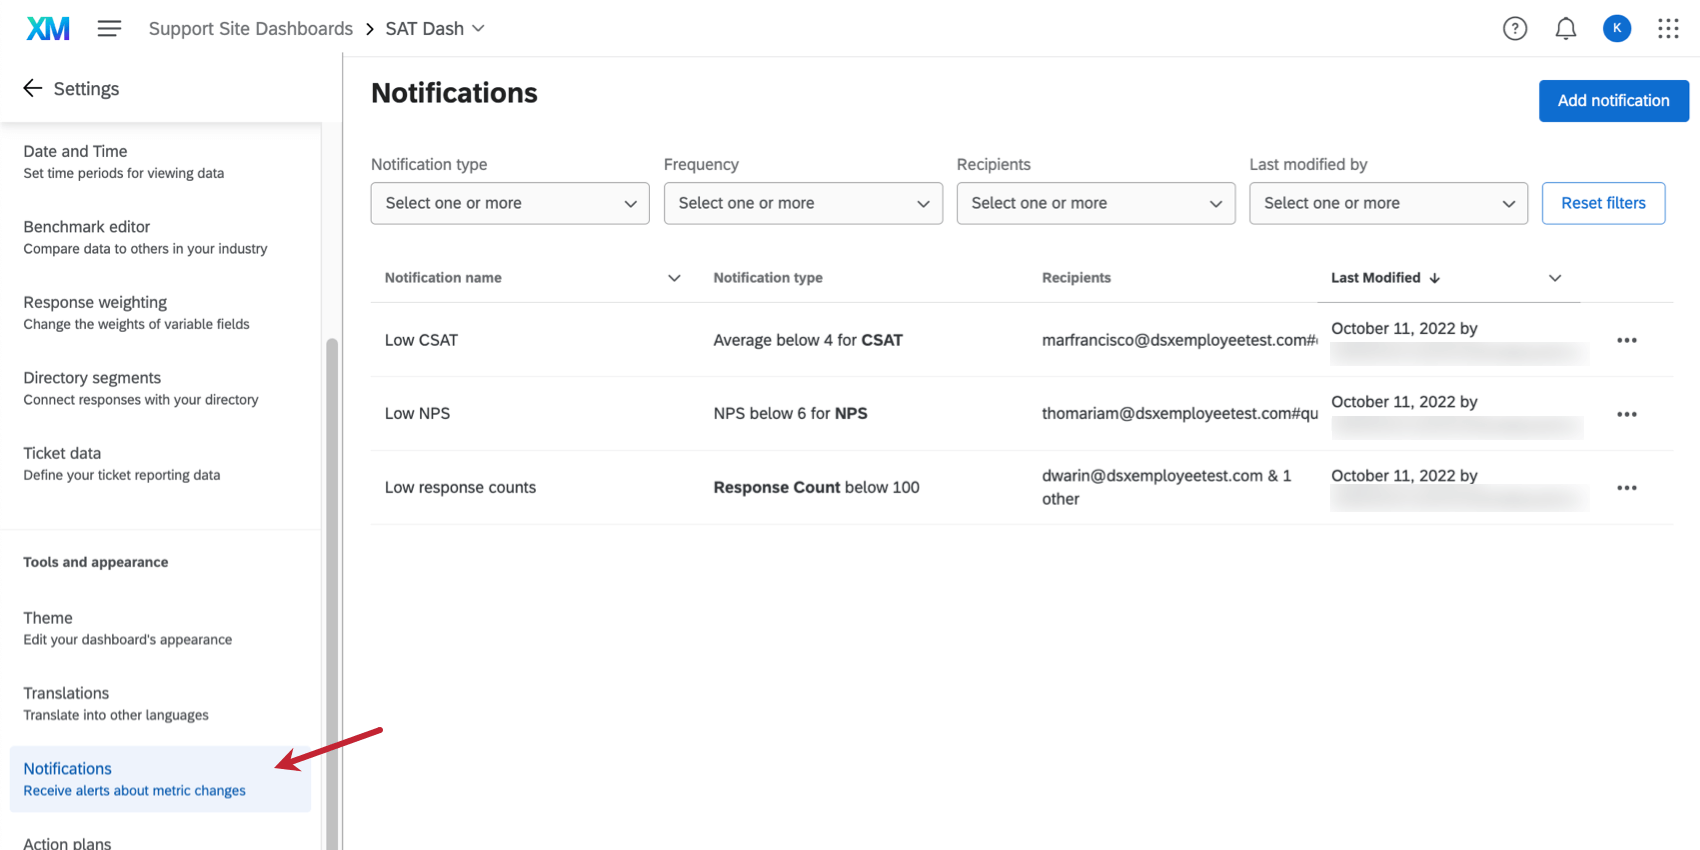
Customize the alerts being sent to your stakeholders by going to your dashboard’s settings and selecting Notifications.
There is a limit of 50 notifications that can be set up per dashboard.
Qtip: You may need to scroll down the notification editor to see all of the options.
Types of Notifications
There are three kinds of notifications you can set up.
- Threshold notifications: Alert the appropriate users or teams when a metric goes above or below a specified threshold within a given period of time.
- Relative Check: Alert the appropriate users or teams when a metric has a positive or negative change in either direction, based on a dynamic threshold.
- Trending Detection: Keep appropriate users updated on topic trends in open-ended feedback.
The reference window for data included in comparisons is based on the frequency you choose. Daily compares the last day’s data to the average of the last 7 days, Weekly compares the last week’s data to the last 30 days, and Monthly compares the last month’s data to the last quarter.
Relative and Trending Notifications
| Cadence Choice | Detection window | Comparison window |
| Daily | 1 day | Last 7 days |
| Weekly | Sun 12:00 am – Sat 11:59 pm | Last 30 days |
| Monthly | Last 30 days | Last 90 days |
How Data is Monitored for All Notifications
| Cadence Choice | How data is monitored |
| Daily | Calculated every day at 8:00am in your chosen time zone. |
| Weekly | Calculated every week at 8:00am in your chosen time zone. |
| Monthly | Calculated every month at 8:00am in your chosen time zone. |
Daily notifications are sent immediately.
Monthly and weekly notifications are sent individually over account notifications and mobile notifications. Over email, alerts are collected & sent as one email.
Setting Up Threshold Notifications
Threshold notifications are meant to notify the appropriate users when a metric goes above or below a specified threshold, within a given period of time.
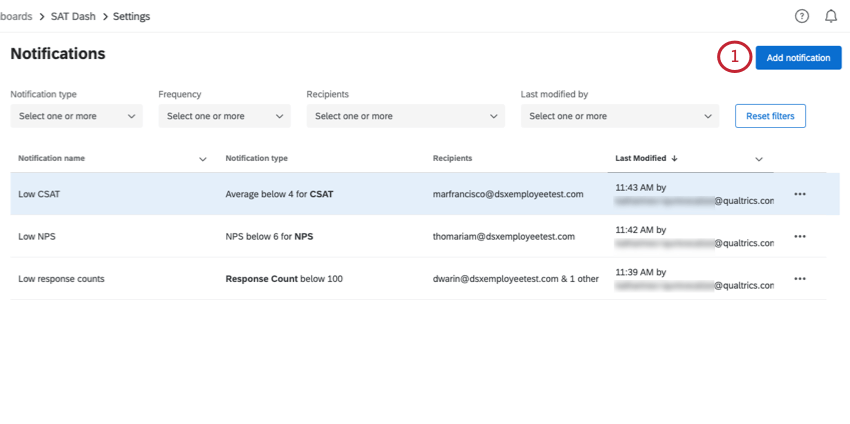
- Click Add notification.
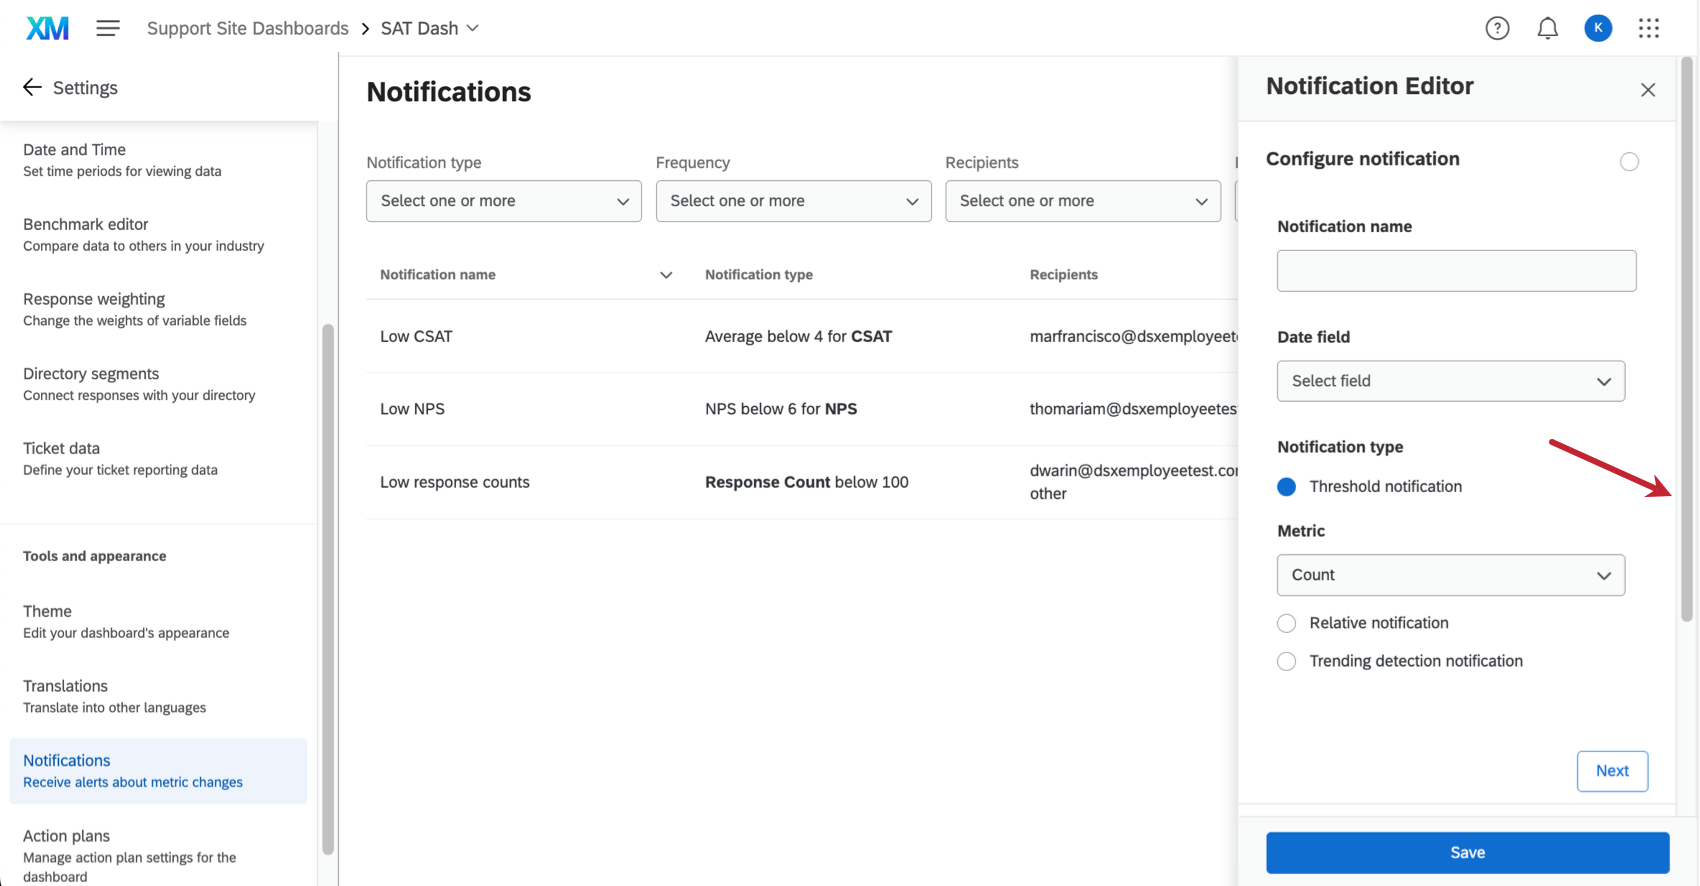
- Name the notification.
- Since these notifications capture data changes within a certain timeframe, set a Date field that timeframe can be based off. You can choose between:
- _recordedDate, which is the date the response was recorded by Qualtrics
- Date fields that you have mapped in your data
Qtip: If working with survey data, we advise using the Survey Metadata – End Date This measures the date the survey was completed.
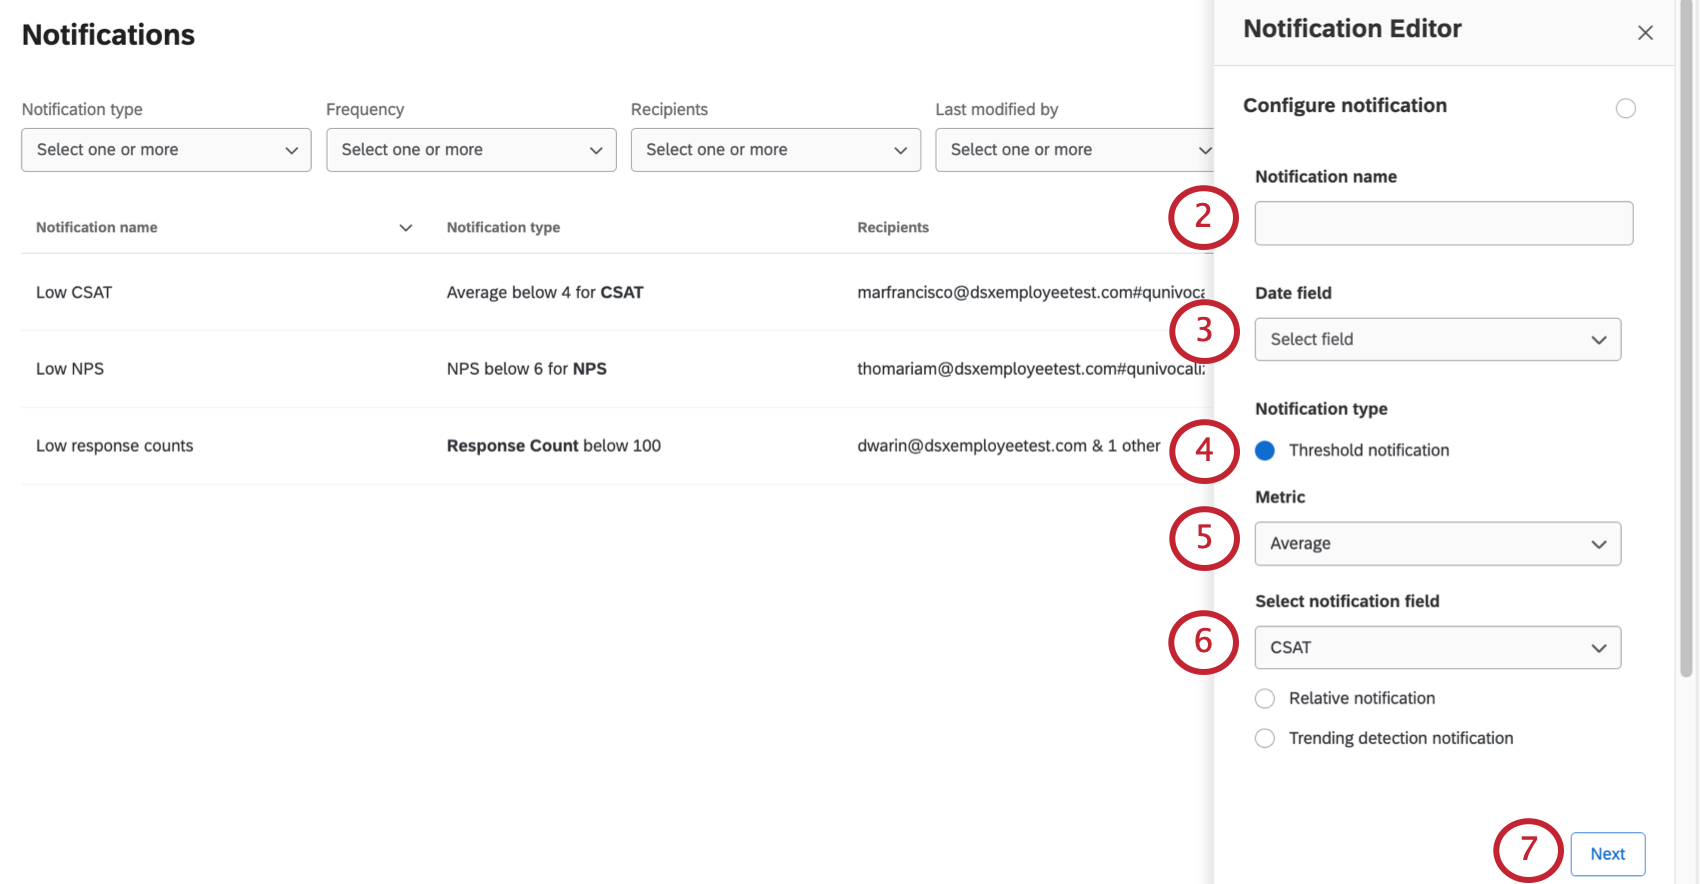
- Select Threshold notification.
- You will have the following options for Metric:
- NPS®: The Net Promoter Score® of the selected field. You will be notified if the value is above or below your set value.
- Count: The number of responses received. E.g., if you want to be alerted when your survey has more than 100 responses for the past week.
- Average: The average of the selected field. You will be notified if the value is above or below your set value.
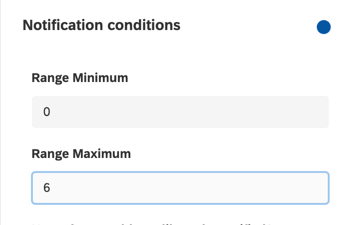
- Top / Bottom Box: Track when a certain proportion of responses are in the top or bottom box of a scaled question. You will be asked to set the minimum range and the maximum range of the box you are tracking. This calculates the proportion of responses in that specified range compared to the total responses and will set a threshold based on that proportion. Top / Bottom Box is only meaningful when working with a scaled question, e.g., rating satisfaction on a scale from 1 to 7, CSAT, NPS, CES, and so on.
Example: In this screenshot, we’re using an NPS value as an example. We want to know if we get more than 30 detractors in a week’s worth of data. We know detractors (our “bottom box”) score from 0 to 6 out of 10 on an NPS. So our minimum range is 0, and our maximum range is 6. The threshold is 30, because we want to know when we get more than 30 detractor responses in a week.
- Any custom metrics you have created.
- If you selected a metric other than count, select the field you want to detect changes in. You have the following options:
- Response Count (this is the number of responses in a dashboard and is not based on a single field)
- Any Numeric Value fields that are mapped in the dashboard data
- Click Next.
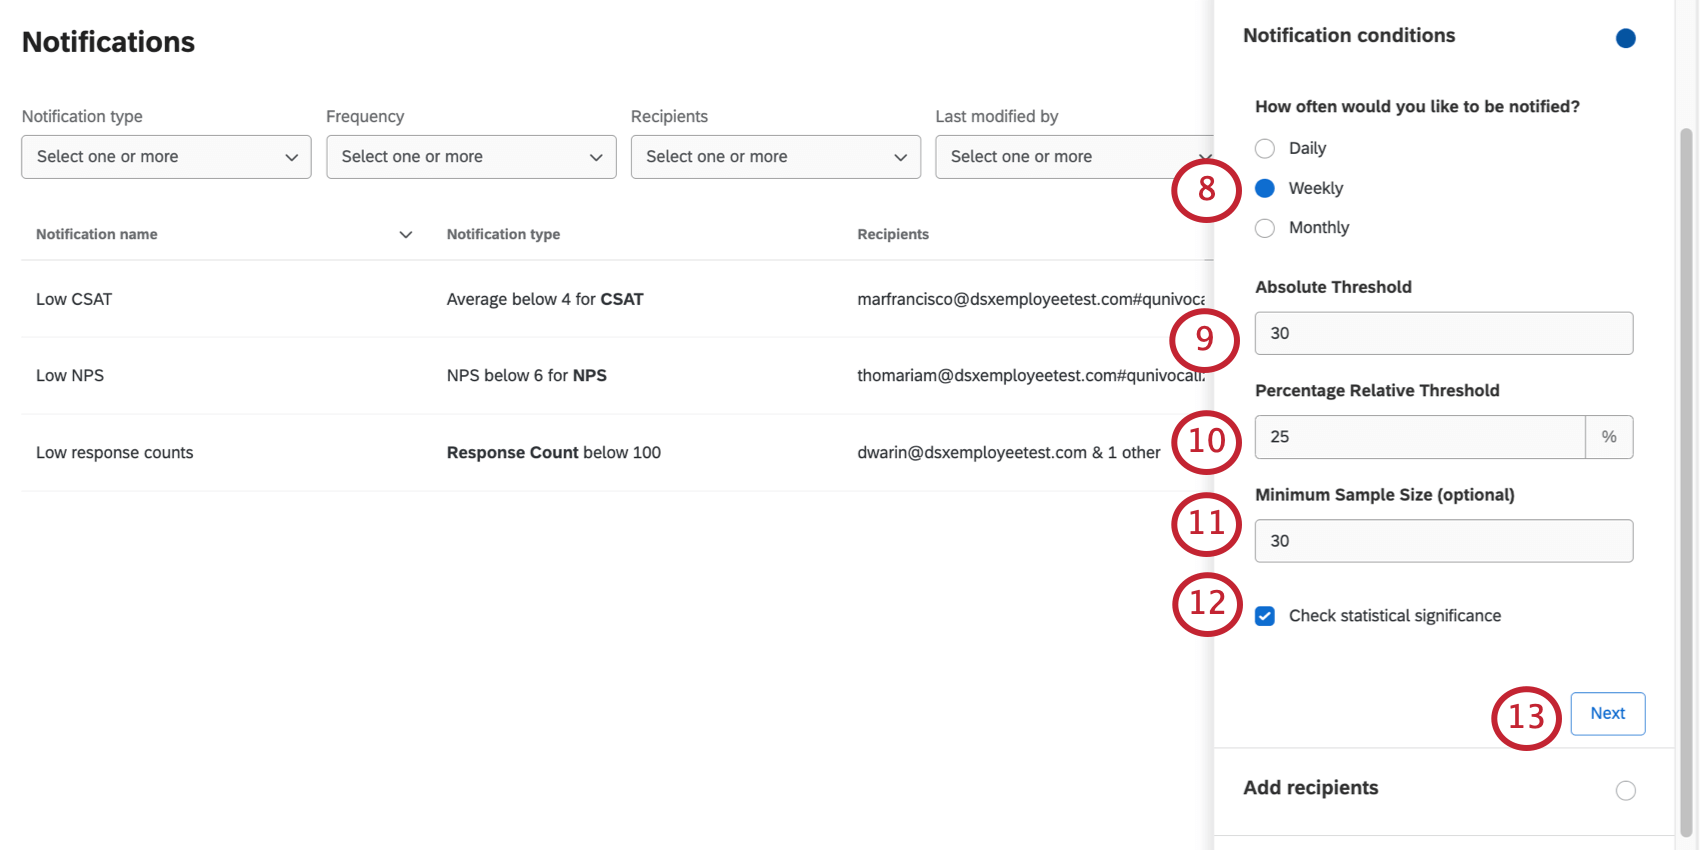
- Select how frequently you want recipients to be alerted.
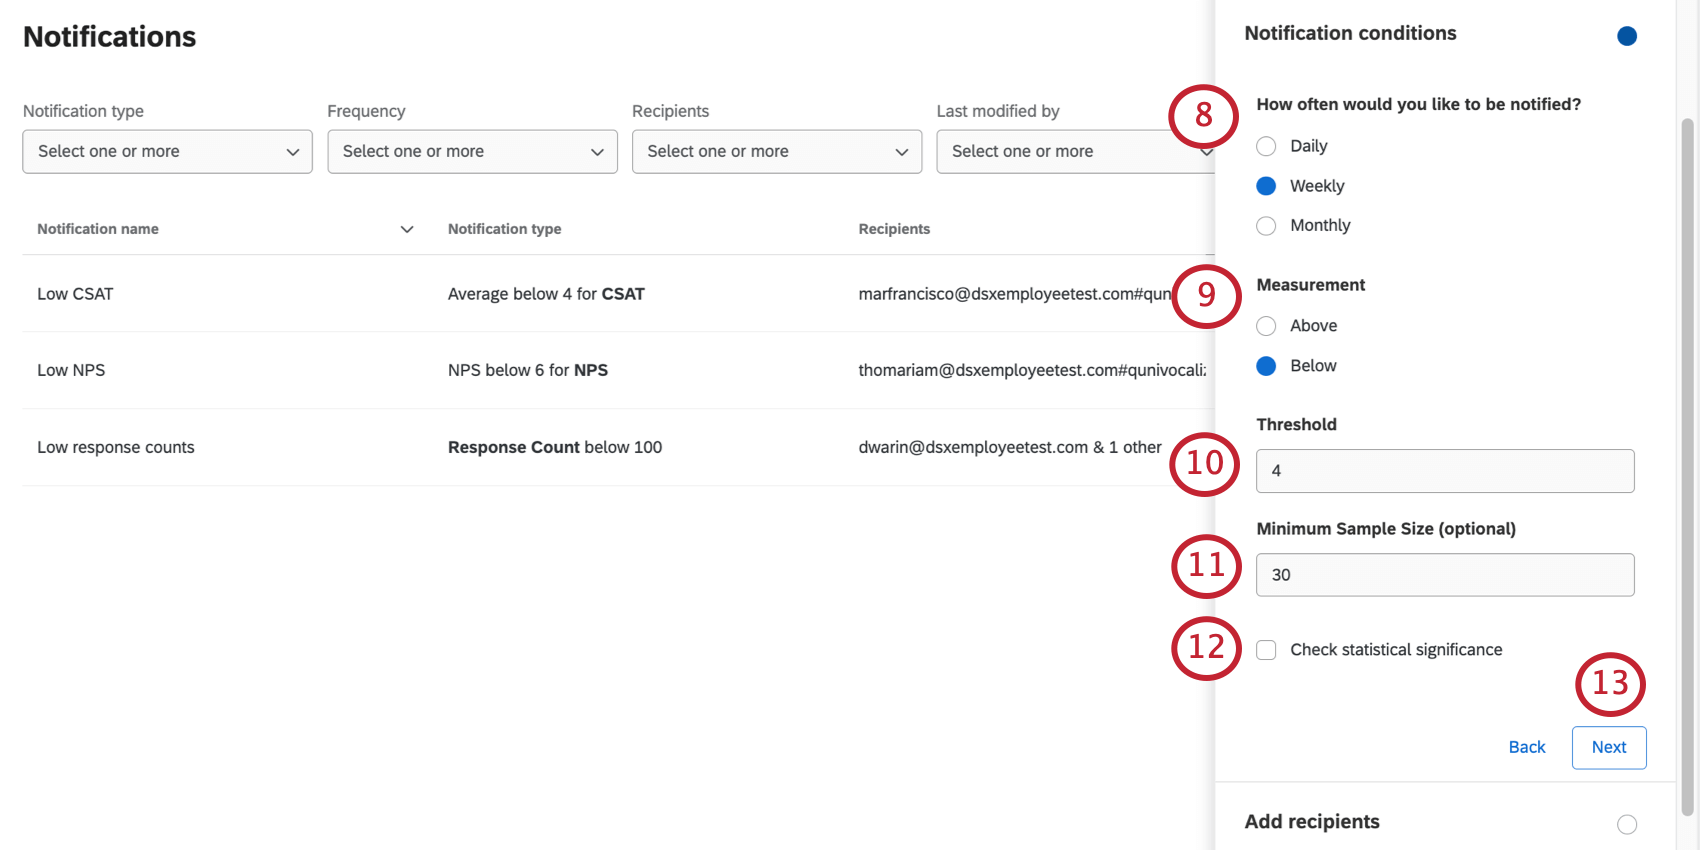
- Choose whether you want this change to be above or below a certain threshold.
- Enter the value of the threshold.
- If desired, set a minimum sample size the data must meet before recipients are notified.
- If desired, select Check statistical significance. That way recipients not only find out if the threshold was met, but whether that result is significant or not.
- Click Next.
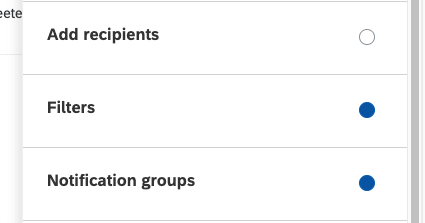
- Select who you want to send these notifications to. You can select individual users or entire roles by name.
 Qtip: Selecting roles allows you to apply data restrictions to the notifications.Qtip: Only users with access to the dashboard can receive these notifications.
 - Click Next.
- If you’d like to add a filter to this data, you can use any of your dashboard’s saved filters.
 Qtip: Time-based filters are ignored – your choice of daily/weekly/monthly, and the date field choice, automatically determines the time filters used.Qtip: When saved filters are used in dashboard notifications, the saved filter is one-time copied. Any changes to the saved filter on the dashboard are not reflected in dashboard notifications.
 - You can also filter off of user attributes. This can be used instead of or in addition to saved filters.
- First, select an Open Text or Text Set field mapped in your dashboard.
- Next, select a user attribute.
Qtip: The value of the dashboard field and the user attribute should match, like when you set a filter where the default value matches a user attribute.
- Click Next.
- Notifications groups are optional. You should use this feature if you want to send separate notifications for each value in the group. For this step, the field you want to break out notifications by should be mapped to your dashboard.
 Example: You have a “Region” field with possible values APJ, US, and EMEA. When you receive a CSAT notification, you’d like to see how each of these regions performs on average CSAT rather than just an overall average CSAT for the company. Thus instead of one average CSAT, you will see a value for APJ, a value for the US, and a value for EMEA.Qtip: You can group by up to three fields at a time.Warning: Use this feature with caution. If you create notification groups with fields that have many values, this can create many more notifications. For example, if a field has a thousand values, that’s a thousand more notifications.
 - Click Save.
Setting Up Relative Notifications
A relative notification is meant to notify the appropriate users when a metric has a positive or negative change in either direction, based on a dynamic threshold.
- Click Add notification.
- Name the notification.
- Since these notifications capture data changes within a certain timeframe, set a Date field that timeframe can be based off. You can choose between:
- _recordedDate, which is the date the response was recorded by Qualtrics
- Date fields that you have mapped in your data
Qtip: If working with survey data, we advise using the Survey Metadata – End Date This measures the date the survey was completed.
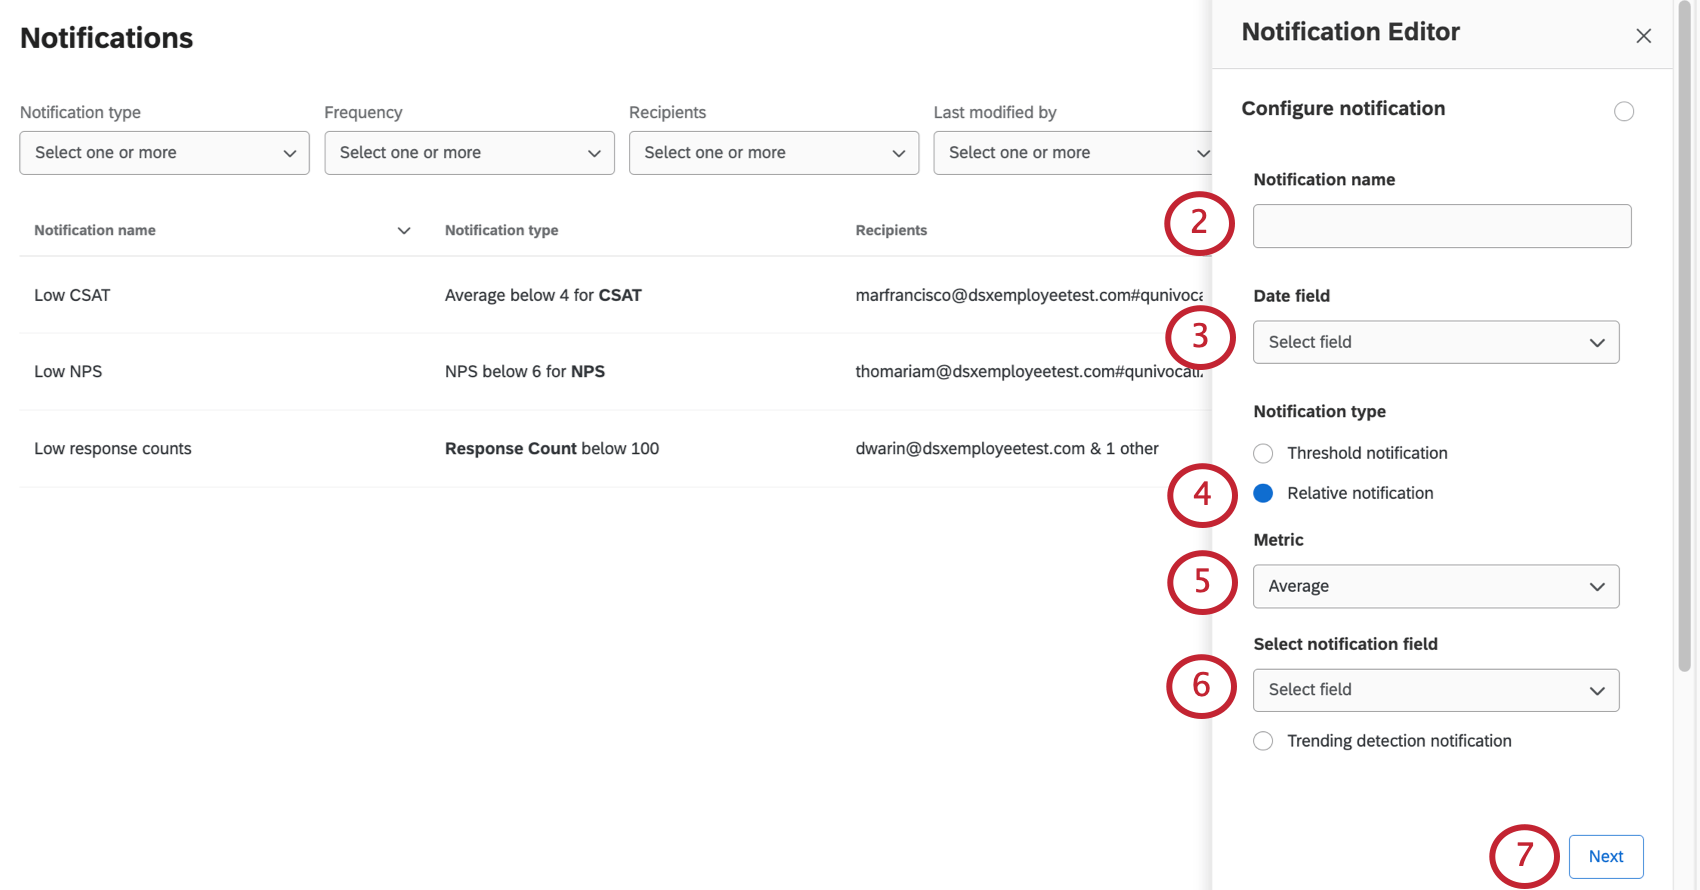
- Select Relative notification.
- You will have the following options for metric:
- NPS®: The Net Promoter Score® of the selected field. You will only be notified if the change from the threshold is significantly different, with a 95% confidence.
- Count: The number of responses a field / question received. E.g., if you want to be alerted when your CSAT question has more than 100 responses for the past week.
- Average: The average of the selected field. You will only be notified if the change from the threshold is significantly different, with a 95% confidence.
- Top / Bottom Box: Track when a certain proportion of responses are in the top or bottom box of a scaled question. You will be asked to set the minimum range and the maximum range of the box you are tracking. This calculates the proportion of responses in that specified range compared to the total responses and will set a threshold based on that proportion. Top / Bottom Box is only meaningful when working with a scaled question, e.g., rating satisfaction on a scale from 1 to 7, CSAT, NPS, CES, and so on.
- Any custom metrics you have created.
- If you selected a metric other than count, select the field you want to detect changes in. You have the following options:
- Response Count (this is the number of responses in a dashboard and is not based on a single field)
- Any Numeric Value fields that are mapped in the dashboard data
- Click Next.
- Select how frequently you want recipients to be alerted.
- Fill out the Absolute Threshold if you want this change to be above or below a certain threshold.
Qtip: You can leave the Absolute Threshold blank, or you can fill out both an Absolute Threshold and a Percentage Relative Threshold.
- Fill out Percentage Relative Threshold with the percentage of the change you wish to track. If you want to be alerted of a 2% change, enter 2. If you want to be alerted of a 50% change, enter 50.
Qtip: You will be alerted of both positive and negative changes that match or exceed this percentage.
- If desired, set a minimum sample size the data must meet before recipients are notified.
- If desired, select Check statistical significance. That way recipients not only find out if the threshold was met, but whether that result is significant or not.
- Click Next.
- Select who you want to send these notifications to. You can select individual users or entire roles by name.
Qtip: Selecting roles allows you to apply data restrictions to the notifications.Qtip: Only users who have access to this dashboard can receive notifications. - Click Next.
- If you’d like to add a filter to this data, you can use any of your dashboard’s saved filters.
Qtip: Time-based filters are ignored – your choice of daily/weekly/monthly, and the date field choice, automatically determines the time filters used.Qtip: When saved filters are used in dashboard notifications, the saved filter is one-time copied. Any changes to the saved filter on the dashboard are not reflected in dashboard notifications. - You can also filter off of user attributes. This can be used instead of or in addition to saved filters.
- First, select an Open Text or Text Set field mapped in your dashboard.
- Next, select a user attribute.
Qtip: The value of the dashboard field and the user attribute should match, like when you set a filter where the default value matches a user attribute.
- Click Next.
- Notifications groups are optional. You should use this feature if you want to send separate notifications for each value in the group. For this step, the field you want to break out notifications by should be mapped to your dashboard.
Example: You have a “Region” field with possible values APJ, US, and EMEA. When you receive a CSAT notification, you’d like to see how each of these regions performs on average CSAT rather than just an overall average CSAT for the company. Thus instead of one average CSAT, you will see a value for APJ, a value for the US, and a value for EMEA.
Qtip: You can group by up to three fields at a time.Warning: Use this feature with caution. If you create notification groups with fields that have many values, this can create many more notifications. For example, if a field has a thousand values, that’s a thousand more notifications. - Click Save.
Setting Up Trending Detection Notifications
Trending detection notifications are meant to track popularity trends in Text iQ topics. If certain topics come up again and again in open-ended feedback, this notification can alert you of those changes.
- Click Add notification.
- Name the notification.
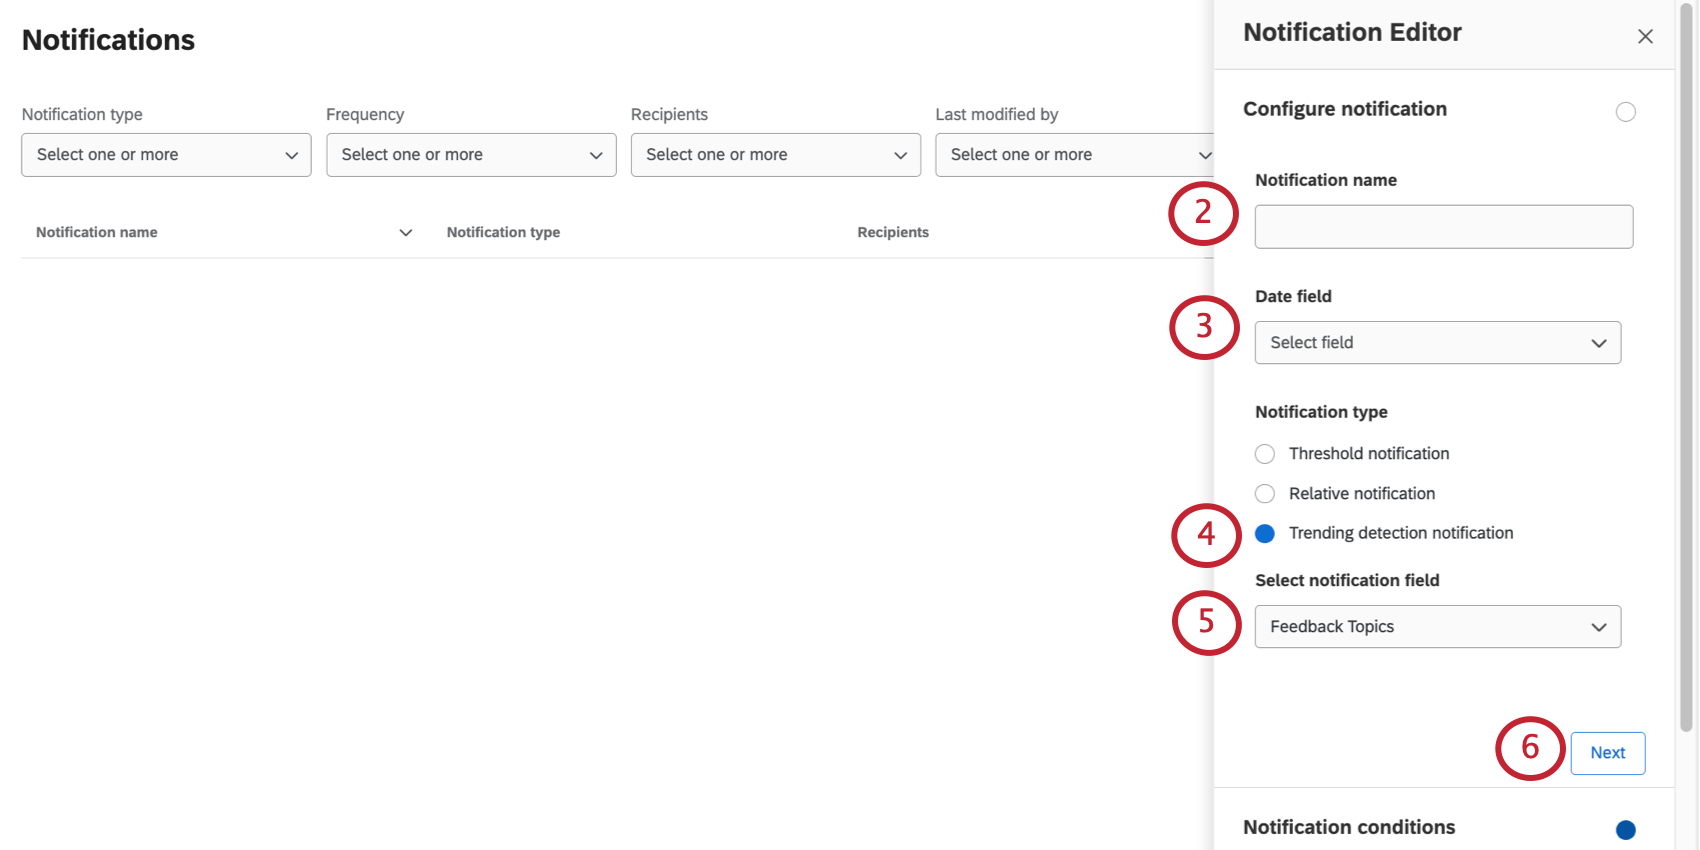
- Since these notifications capture data changes within a certain timeframe, set a Date field that timeframe can be based off. You can choose between:
- _recordedDate, which is the date the response was recorded by Qualtrics
- Date fields that you have mapped in your data
Qtip: If working with survey data, we advise using the Survey Metadata – End Date This measures the date the survey was completed.
- Select Trending detection notification.
- Select the field you want to detect changes in. You can add any Number Set, Multi-Answer Text Set, or Text Set fields that are mapped in the dashboard data. We recommend you add topics or sentiments you have mapped in the dashboard.
- Click Next.
- Select how frequently you want recipients to be alerted.
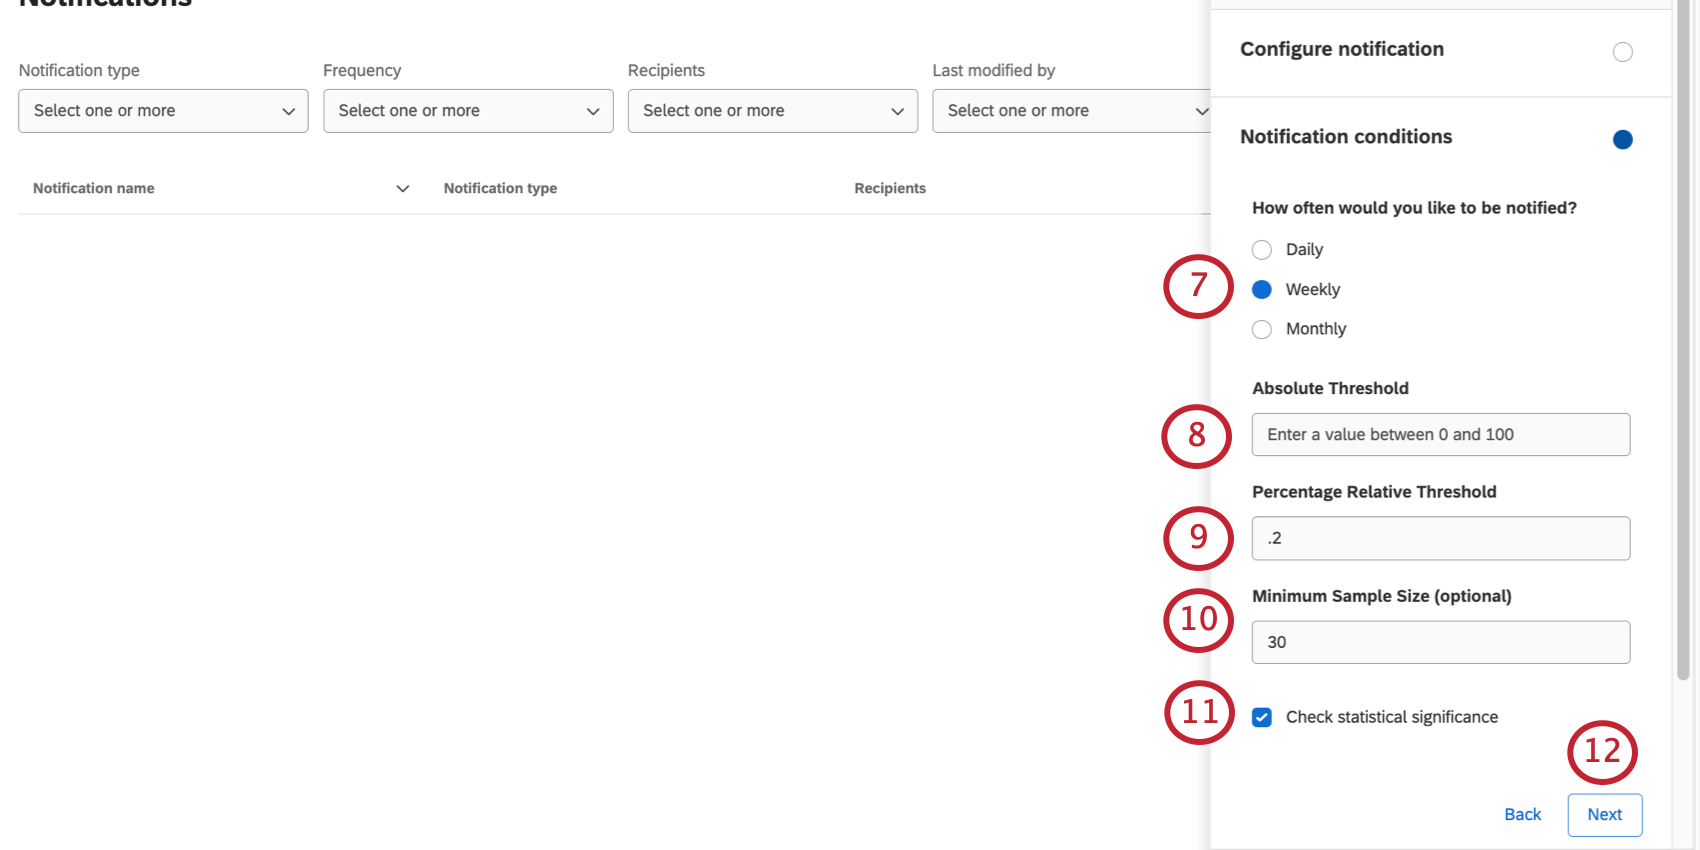
- Fill out the Absolute Threshold if you want the number of responses to this field to be above or below a certain number.
Qtip: You can leave the Absolute Threshold blank, or you can fill out both an Absolute Threshold and a Percentage Relative Threshold.
- Fill out Percentage Relative Threshold with the percentage of the change you wish to track. If you want to be alerted of a 2% change, enter 2. If you want to be alerted of a 50% change, enter 50.
Qtip: You will be alerted of both positive and negative changes that match or exceed this percentage.
- If desired, set a minimum sample size the data must meet before recipients are notified.
- If desired, select Check statistical significance. That way recipients not only find out if the threshold was met, but whether that result is significant or not.
- Click Next.
- Select who you want to send these notifications to. You can select individual users or entire roles by name.
 Qtip: Selecting roles allows you to apply data restrictions to the notifications.Qtip: Only users with access to the dashboard can receive these notifications.
 - Click Next.
- If you’d like to add a filter to this data, you can use any of your dashboard’s saved filters.
 Qtip: Time-based filters are ignored – your choice of daily/weekly/monthly, and the date field choice, automatically determines the time filters used.Qtip: When saved filters are used in Dashboard Notifications, the saved filter is one-time copied. Any changes to the saved filter on the dashboard are not reflected in dashboard notifications.
 - You can also filter off of user attributes. This can be used instead of or in addition to saved filters.
- First, select an Open Text or Text Set field mapped in your dashboard.
- Next, select a user attribute.
Qtip: The value of the dashboard field and the user attribute should match, like when you set a filter where the default value matches a user attribute.
- Click Next.
- Notifications groups are optional. You should use this feature if you want to send separate notifications for each value in the group. For this step, the field you want to break out notifications by should be mapped to your dashboard.
 Example: You have a “Region” field with possible values APJ, US, and EMEA. When you receive a CSAT notification, you’d like to see how each of these regions performs on average CSAT rather than just an overall average CSAT for the company. Thus instead of one average CSAT, you will see a value for APJ, a value for the US, and a value for EMEA.Qtip: You can group by up to three fields at a time.Warning: Use this feature with caution. If you create notification groups with fields that have many values, this can create many more notifications. For example, if a field has a thousand values, that’s a thousand more notifications.
 - Click Save.
What’s Included in Dashboard Notifications
Regardless of whether you add a filter to the notification, the data shared by these notifications is restricted by user and role-level permissions, just like the user’s dashboard view. Each user will only see what you have configured them to see.
Notification Channels
Notifications appear on three different channels. We will list what notification frequencies go to each channel.
- Account Notifications Feed: Daily alerts and weekly alerts are sent here.
- Push Notifications: Send to any device where you have downloaded the XM App and enabled push notifications in the app’s settings. Daily alerts and weekly alerts are sent here.
- Emails: There are different email formats based on whether you chose daily as your frequency or weekly/monthly. See more below.
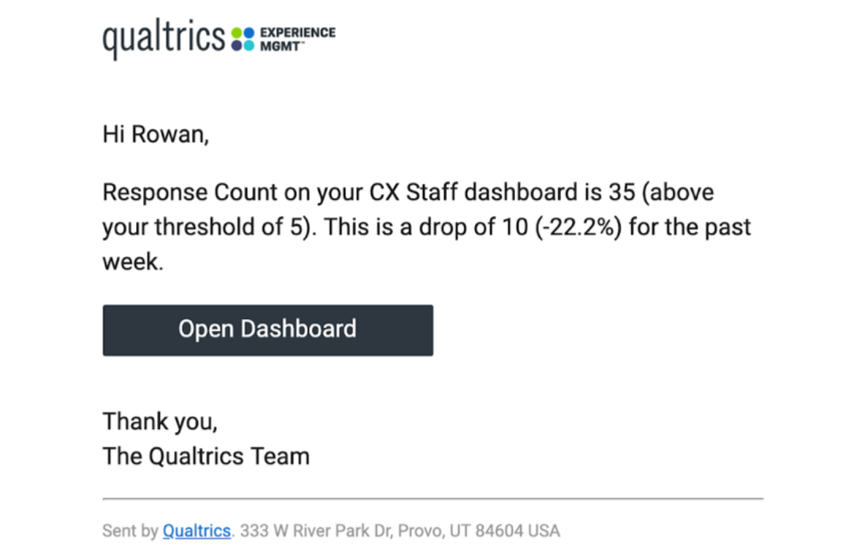
Daily emails
Once a significant change matching the conditions of the alert has been detected, the recipients of the alert will receive an email at the address connected to their account. The email will give the current value of the chosen metric, the threshold, the amount of change, and a directional (positive or negative) percentage of change. There will also be a button the recipient can use to log into the dashboard.
Weekly and monthly notifications
Weekly and monthly notifications come in the form of a digest, organized as a list of notifications triggered within the specified time period.
Sorting and Filtering Notifications
Sorting
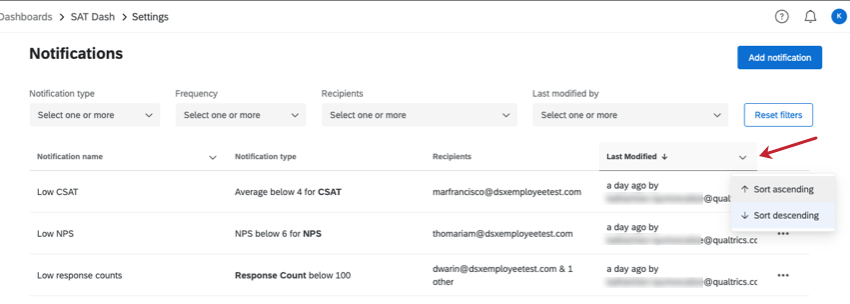
For every notification, you’ll see the following columns of information:
- Notification name: The name of the notification.
- Notification type: A description of the type of data that triggers the notification (e.g., “Average below 4 for CSAT”).
- Recipients: The dashboard users who receive these notifications.
- Last modified: When the notification was last edited and the user who edited it.
You can sort by the Notification name and Last modified column. Click the header name to change the sort direction, or click the dropdown next to the column name to switch between Sort ascending and Sort descending.
Filtering
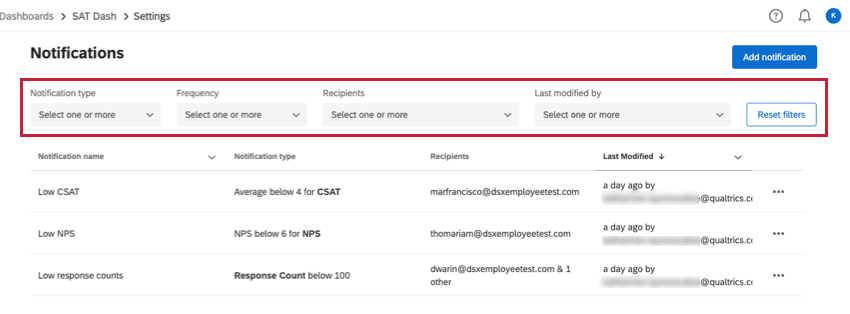
You can filter notifications by the following:
- Notification type: Threshold, relative, or trending detection notifications.
- Frequency: Daily, weekly, or monthly.
- Recipients: The users the notifications are sent to. You can type a username or name to search.
- Last modified by: The user who last modified any notifications. You can type a username or name to search.
To remove all the filters you’ve added, click Reset filters.
Editing, Copying, and Deleting Notifications
Once you’ve created a notification, you can use the dropdown next to it to edit the notification, copy it, or delete it.
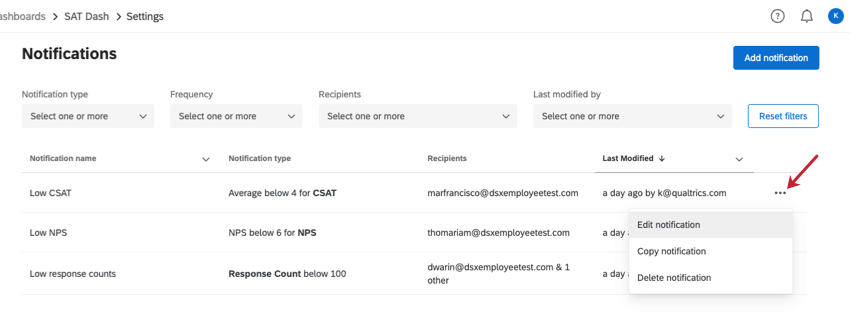
There is no way to temporarily turn a notification off.