 XM Knowledge Base
What is sampling?
Sampling means picking out a few individuals from a larger group that will stand in for the whole. Sampling is done when it’s impractical to survey the whole population of interest. Like sampling small quantities of cheese at the deli counter to get an idea of what the whole block of cheese will taste like, sampling in research gives you a fairly accurate picture of the characteristics of the whole research population without having to analyze the whole thing.
More formally, in survey research sampling is the process of using a subset of a population to understand the whole population. To help illustrate this further, let’s look at data sampling methods with examples below.
Let’s say you wanted to understand what North Americans thought about a particular issue. To ask every person on the continent to participate would be almost impossible. Even if everyone said “yes”, carrying out a survey across different countries and different states, in different languages and timezones, and then collecting and processing all the results, would take a long time and be very costly.
Sampling allows large-scale research to be carried out with a more realistic cost and time-frame. That’s because it uses a smaller number of individuals in the population with representative characteristics to stand in for the whole.
Sampling allows us to do things like carrying out exit polls during elections, mapping the spread and effect rates of epidemics across a geographical area’s entire population, and carrying out nationwide census research that provides a snapshot of society and culture.
Sampling is great for making your research quicker and less costly to do. However, how you choose individuals will affect how well your sample represents the population you are trying to understand.
There are many ways to carry out sampling, ranging from random selection to a more methodical approach. As you learn more about sampling, it’s useful to know the definitions of some of the most common terms.
Sampling definitions:
- Population
The total number of people or things you are interested in - Sample
A smaller number within your population that will represent the whole - Sampling
The process and method of selecting your sample - Sampling frame
The sampling frame is the source material used to select a sample. An example would be the telephone book, or a company’s email subscriber list.
Free eBook: Determining sample size
Determining the target population
Before you can decide how to choose individuals for your sample, you have to identify who is in your target population and who is not. For example, if you want to know what Americans think about a presidential candidate, your target population should be people who can vote in the United States. Therefore, people under 18 and people who are not US citizens would be considered out of scope.
The importance of sample size
We know that a sample is smaller than the entire population you’re researching, but how large should your sample be? The ideal sample size to accurately represent your target population will depend on a variety of factors. It will depend on how large the target population is – larger populations need larger sample sizes. It starts to level off after about 20,000 though.
So don’t worry too much about whether your target population includes 2.1 million people or 2.2 million people as it won’t change your recommended sample size. Then there’s whether it’s cost effective – how many people or items can you afford to include in your research project? Then there is practicality – how easy is it going to be to collect your samples? And there’s how precise you need your data to be – usually that’s as precise as possible, but you may have to strike a balance between keeping costs down and being able to make solid statistical inferences.
Typically, there’s a sweet spot between sampling too many people or items, which delivers diminishing returns on your time and effort, and sampling too few people, which will lack precision. Too small a sample selection introduces the risk that your sample won’t be representative of the target audience, because the small number you’ve selected are not typical of the entire population.
To make life easier, we’ve provided a sample size calculator. To use it, you need to know your
- Population size
In statistics, a population is the pool of individuals from which a statistical sample is drawn for a study.
- Confidence level
The confidence level indicates the probability that a sample is true for the entire population from which it was sampled. Confidence levels help statisticians better understand how accurate their samples are. The most common confidence levels are 90%, 95% and 99%. A 99% confidence level in statistics means that the researcher is certain that the sample accurately reflects the whole, or falls within the confidence interval.
- Margin of error (confidence interval)
Margin of error (also known as confidence interval) measures the degree of certainty or uncertainty in a sampling method. It’s the mean of your estimate plus and minus the variation in that estimate. This provides a range of values between which you expect your estimate to fall should you redo your test (within a certain level of confidence).
For example, confidence intervals are computed at a designated confidence level — 95% being the most common. A 95% confidence level with a 5% margin of error/confidence interval means that if you were to run the same study 100 more times, 95 times out of 100, the value would have been +5 or -5 points of the value you got the first time.
If any of those terms are unfamiliar, have a look at our blog post on determining sample size for details of what they mean and how to find them.
Try the sample size calculator
Probability sampling methods vs non-probability sampling
Sampling strategies in research vary widely across different disciplines and research areas. Sampling also varies from study to study.
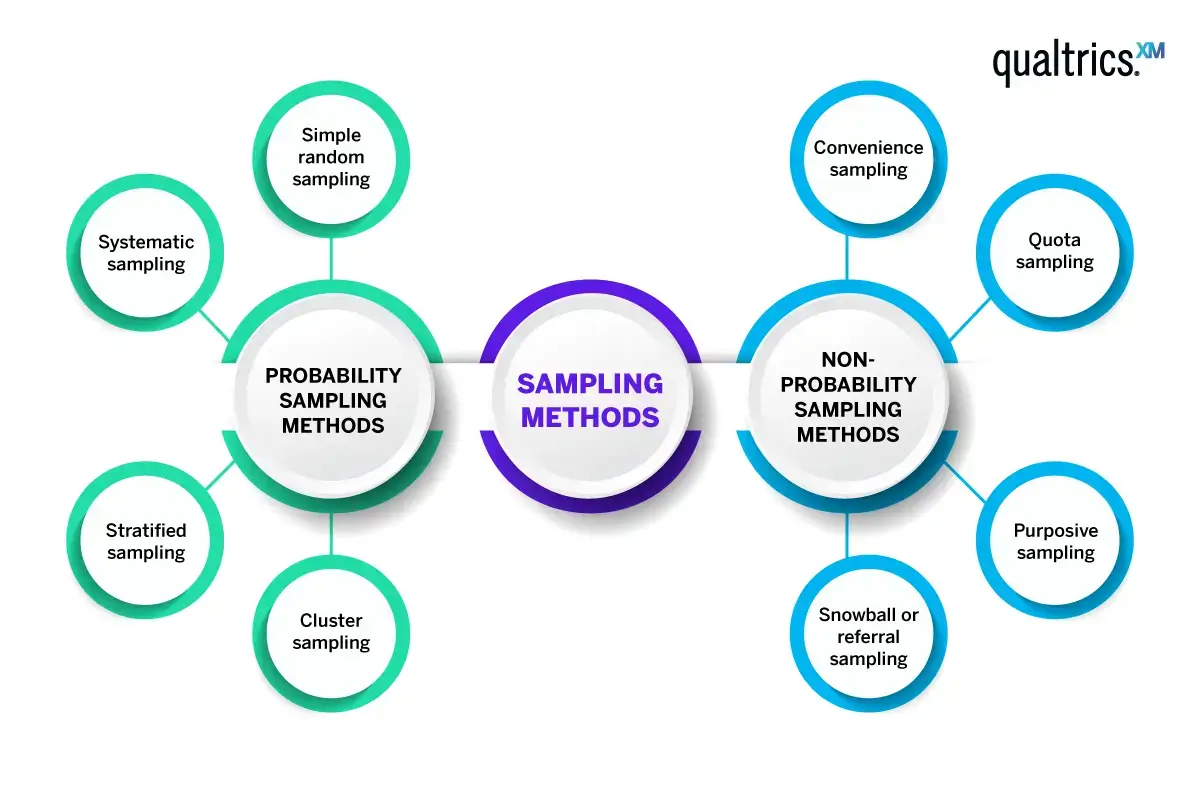
There are two major types of sampling methods – probability and non-probability sampling.
- Probability sampling, also known as random sampling, is a kind of sample selection where each member of the target population has a known, non-zero chance of being selected. Imagine there are 10 red balls and 20 blue balls in a bowl and you reach in and pick one. Each of those balls had a known, non-zero chance of being selected. There was a 33% chance of selecting a red ball and a 67% chance of selecting a blue ball.
- Non-probability sampling, also known as convenience sampling, techniques are where the researcher deliberately picks items or individuals for the sample. They choose the sample based on their research goals or knowledge and convenience.
A note on sampling and non-sampling errors
We’re mostly familiar with the term ‘margin of error’, also known as sampling error. It refers to the amount of error or inaccuracy that creeps into every study as a result of the sampling process. It can be reduced, but not entirely eliminated.There are also some preventable sources of error – known, somewhat as non-sampling errors. This category includes things like coverage error, nonresponse bias, and measurement error.
- Coverage error occurs when your sampling frame does not include all members of the target population. For example, maybe your customer list only includes people with email addresses.
- Nonresponse error (typically referred to as nonresponse bias) happens when those who respond to the survey are different from those who do not, in terms of the concepts you’re measuring, giving you an inaccurate representation. For example, imagine you’re measuring ice-cream flavor preference in a population that is equally fond of strawberry and chocolate, If only people who like chocolate ice-cream respond to your survey, you could conclude falsely that chocolate is the only flavor people like.
- Measurement error refers to any error that comes from the people who respond to the survey. It could be because of the respondent themselves, an interviewer (if used), the questionnaire, or data and data-processing issues.
Learn more about sampling and non-sampling errors
Probability sampling methods
There are a wide range of probability sampling methods to explore and consider. Here are some of the best-known options.
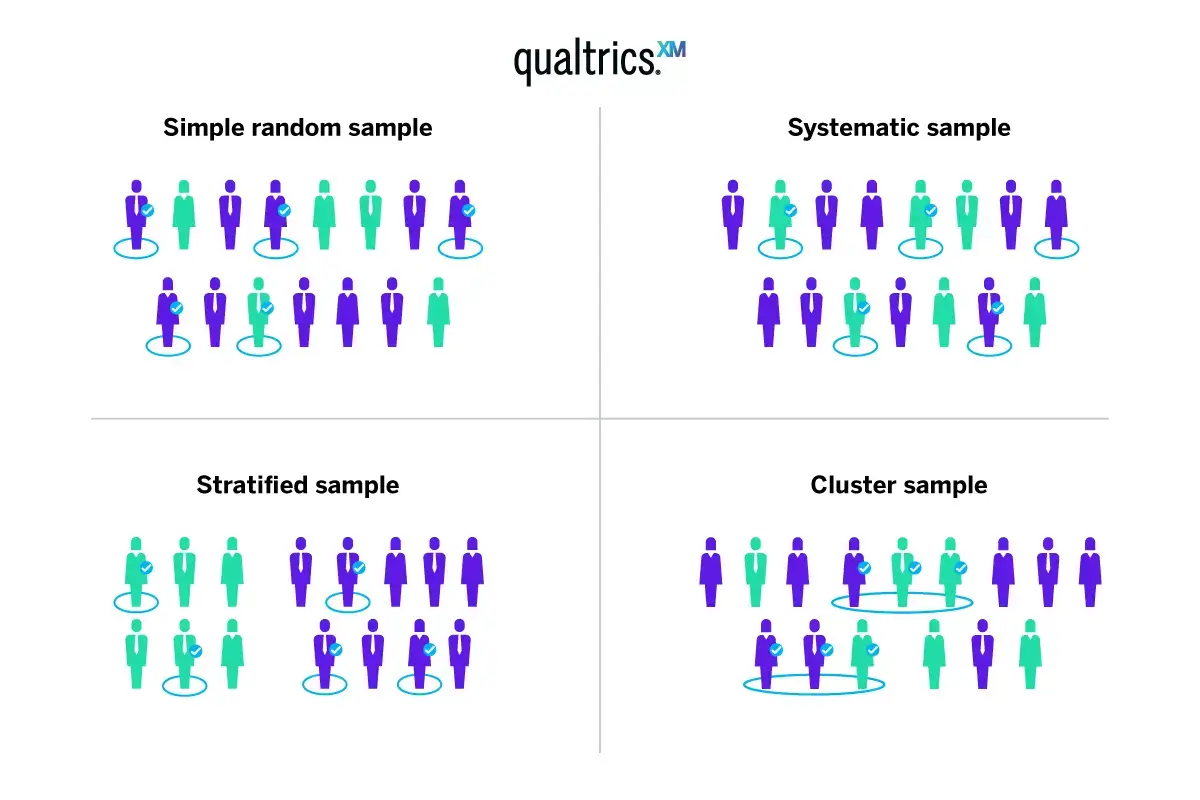
1. Simple random sampling
With simple random sampling, every element in the population has an equal chance of being selected as part of the sample. It’s something like picking a name out of a hat. Simple random sampling can be done by using a random number generator to assign each item or person in the population a number and then picking numbers at random.
Simple random sampling is easy to do and cheap, and it removes selection bias from the sampling process. However, it also offers no control for the researcher and may lead to unrepresentative groupings being picked by chance. For example, even though the population is 50% female, you may end up with 60% females in your sample just by chance.
The risk of unrepresentativeness just due to chance gets smaller as your sample size gets bigger.
Simple random sampling example:
Sharon is a business owner who is interested in studying customer satisfaction (CSAT) scores to see if they improve year on year. She wants to study a selection of customers from the current year to see how they compare to future years. Probability sampling can help her judge whether the customers are more satisfied year on year, or if it’s down to chance or even wishful thinking.
Sharon has 1,000 customers in the current year. She needs a simple random sample of customers, so she uses a random number generator to pick 300 customers from the list of 1,000. This gives her a random sample which represents the whole population of interest in an unbiased way.
2. Systematic sampling
With systematic sampling, also known as systematic clustering, the random selection only applies to the first item chosen. A rule then applies so that every nth item or person after that is picked at regular intervals.
Although there’s randomness involved, the researcher can change the interval at which items are picked, which allows them to make sure the selections won’t be accidentally clustered together.
Systematic sampling example:
Joe is working in a factory that makes plastic washers on an assembly line. He needs to spot-check the washers to make sure they’re all the right size and shape. He uses systematic sampling to randomly choose the washers he will examine as they come off the production line – he uses a random number generator to pick his starting point – 127.
The factory produces 10,000 washers a day, and Joe needs a sample of 100. So first he’ll look at washer no. 27, and then every 100th washer after that one. Systematic sampling works well for Joe because he can stand beside the production line and pick out his washers without adding extra work for himself or the other factory workers.
3. Stratified sampling
Stratified sampling involves random selection within predefined groups. It’s useful when researchers know something about the target population and can decide how to subdivide it (stratify it) in a way that makes sense for the research. Stratified sampling has benefits but it also introduces the question of how to stratify a population, which can create more risk of bias.
Stratified sampling example:
Aliyah is researching customer preferences in a group of shoppers. She has some data on the group members, including whether they are repeat customers or first timers, and she thinks it might be helpful to separate her sampling equally between those who have bought before and those who haven’t.
Aliyah separates the list of customers into new and repeat buyers. She then takes a random sample of equal size from each of the lists.
4. Cluster sampling
With cluster sampling, groups rather than individual units of the target population are selected at random for the test. These might be pre-existing groups, such as people in certain zip codes or students belonging to an academic year. It’s important that each cluster is representative of the whole population, and that the clusters don’t overlap one another.
Cluster sampling can be done by selecting the entire cluster, or in the case of two-stage cluster sampling, by randomly selecting the cluster itself, then selecting at random again within the cluster.
Cluster sampling example:
Ayo is a research scientist interested in the dietary choices of different age groups in the US state of Michigan. He needs a random sample from the population, but the total population is so huge that he needs an additional layer of probability sampling method to cut down the potential sample population first.
The state has a number of counties, each of which contains people representing a range of ages. Each county can be treated as a cluster for Ayo’s purposes. He randomly chooses 2 counties to sample from. These are still very big groups, so he takes a random sample of people from each one to invite to take part in his survey.
Non probability sampling methods
The non probability sampling methodology doesn’t offer the same benefits as probability sampling, because it doesn’t remove bias. But there are times when non probability sampling is chosen for expediency or simplicity. Here are some forms of non probability sampling and how they work.
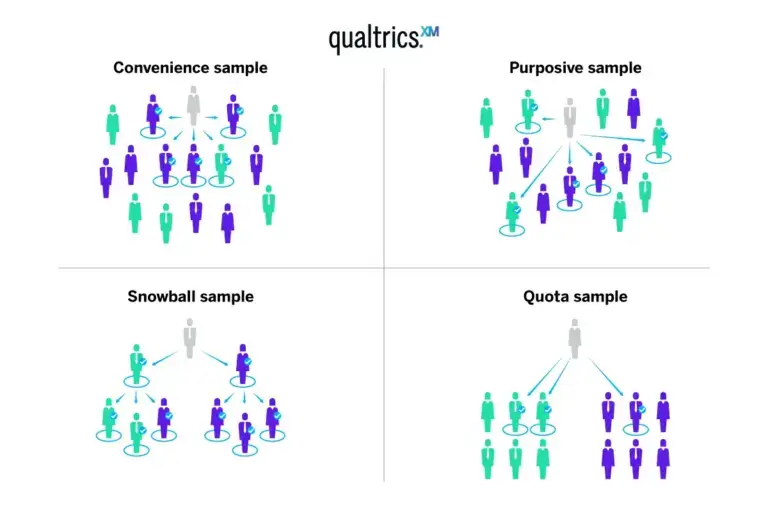
1. Convenience sampling
People or elements in a sample are selected on the basis of their accessibility and availability. This kind of sample can have value, especially if it’s done as an early or preliminary step, but significant bias will be introduced.
Convenience sampling example:
Hamza is planning to carry out a research survey at the university where he works to gather information on work-life balance. Before he spends significant time on research design, he decides to run a quick poll to see whether his research topic produces an interesting variety of responses from the people around him, who he believes will be roughly representative of the larger population.
He asks a convenience sample of his students and co-workers who happen to be on campus with open schedules if they would be willing to take his preliminary questionnaire. Although their answers aren’t going to be part of his study, they give him a better understanding of his research topic and help him prepare for a full study using a probability sampling method.
2. Quota sampling
Like the probability based stratified sampling method, this approach aims to achieve a spread across the target population. It uses certain groups or criteria to choose who should be recruited for a survey. A quota might include a certain number of males and a certain number of females. Alternatively, you might want your samples to be at a specific income level or in certain age brackets or ethnic groups.
Bias may be introduced during the selection itself – for example, volunteer bias might skew the sample towards people with free time who are interested in taking part. Or bias may be part and parcel of the way categories for the quotas are selected by researchers.
Quota sampling example:
Anna works at a school. She has chosen to run a study using non probability sampling methods because she has a small amount of time and a very tight budget. She wants to learn about how cold homes affect children’s learning outcomes. She takes her sample from the subset of the children at her school who qualify for the National School Lunch Program, since this is allocated on the basis of family income.
3. Purposive sampling or judgement sampling
In judgement sampling, participants for the sample are chosen consciously by researchers based on their knowledge and understanding of the research question at hand or their goals. This technique is unlikely to result in a representative sample, but it is a quick and fairly easy way to get a range of results or responses.
Purposive sampling example:
Angela is a specialized nutritionist working with veterans in her state. She is interested in learning how many years living with a strict external meal schedule affects eating habits in later life. In order to carry out her study, she needs to use her expert knowledge to choose participants who have had these experiences and are able to describe their hunger cues. Because of this, and because the number of people available is too small for probability sampling techniques, Angela picks participants by hand to take part in her research.
4. Snowball sampling or referral sampling
With this approach, people recruited to be part of a sample are asked to invite those they know to take part, who are then asked to invite their friends and family and so on. The participation radiates through a community of connected individuals like a snowball rolling downhill.
This method can be helpful when the researcher doesn’t know very much about the target population and has no easy way to contact or access them. However it will introduce bias, for example by missing out isolated members of a community or skewing towards certain age or interest groups who recruit amongst themselves.
Snowball sampling example:
Christian is interested in researching the lives of people who live off-grid via a survey. He can’t use the internet to recruit his participants, and he knows there are relatively few of them within the larger population. Finding them himself will be time consuming. However, he does know one person at his church who is part of an off-grid community that communicates through letters. He contacts this person and asks him if he will help distribute the survey to anyone who might be interested. Christian’s study uses snowball sampling as it’s the sampling method most likely to give him access to his research population.
Avoid or reduce sampling errors and bias
Using a sample is a kind of short-cut. If you could ask every single person in a population to take part in your study and have each of them reply, you’d have a highly accurate (and very labor-intensive) project on your hands.
But since that’s not realistic, sampling offers a “good-enough” solution that sacrifices some accuracy for the sake of practicality and ease. How much accuracy you lose out on depends on how well you control for sampling error, non-sampling error, and bias in your survey design. Hopefully, our blog post helps you to steer clear of some of these issues.
Free eBook: Determining sample size